- 1INTRODUCTION
- 2SETTING UP A NEW SYSTEM
- 2.1The Organisation Structure
- 2.1.1Creating, Editing and Deleting Organisation Chart Items/Adding Posts
- 2.2Users
- 2.2.1Creating, Editing and Deleting Users
- 2.2.2Supporting Data
- 2.2.2.1Access Levels and User Groups
- 2.2.2.2Reporting Group
- 2.3The Strategy Map
- 2.3.1Overview - Flat and Complex Models
- 2.3.2Creating, Editing And Deleting Strategy Map Items
- 2.3.3Strategy Item Types
- 2.3.4StrategyMap Performance Target items
- 2.3.5Strategic Contributions
- 2.3.5.1Normalising Strategic Contributions
- 2.3.5.2Flat Strategy Map
- 2.3.6 Strategy Map Tags
- 2.3.6.1Overview
- 2.3.6.2Setting up data tags
- 2.3.6.3Attaching data tags to performance targets
- 2.3.6.4Reporting data tags
- 2.4Performance Indicators
- 2.4.1Overview
- 2.4.2Performance Indicator List
- 2.4.3Creating, editing and deleting Performance Indicators
- 2.4.4Perspectives and Indicator Types
- 2.4.5Performance Indicators Set Up Considerations
- 2.4.6Supporting data
- 2.4.6.1Performance Indicator Categories
- 2.4.6.2Performance Indicator Types
- 2.4.6.3Scorecard Perspectives
- 2.4.6.3.1How to use Perspectives
- 2.4.6.4Scorecard Perspective Categories
- 2.4.6.4.1How to use Perspective Categories
- 2.4.6.4Units of Measure
- 2.4.6.5Time Intervals
- 2.5Equation Builder
- 2.5.1Creating, Editing, Deleting Equations
- 2.5.1.1Measurements
- 2.5.1.2Parameters
- 2.5.1.3Equations
- 2.5.1.4Example Equation
- 2.5.1.5Attaching Equations to Performance Indicators
- 2.5.1.6Using Performance Indicators in an Equation
- 2.5.1.7Equation measurement workflow
- 2.5.1Creating, Editing, Deleting Equations
- 3PERFORMANCE TARGETS
- 3.1Overview
- 3.2Rules Governing Performance Targets
- 3.3Target Setup: Add/View Targets
- 3.4Target Setup: Target Creation Wizard
- 3.5Entering Target Measurements, Validation and Reporting
- 3.6Editing target fields and related objects
- 3.6.1Edit target fields
- 3.6.2Edit target measurements
- 3.6.3Edit target comments
- 3.6.4Edit target delegation
- 3.7Add/View Responsibility
- 3.8Editing target value for more than one measurer
- 3.9Ending targets
- 3.10TargetExport and Import
- 3.11Exporting Target Data
- 3.12Importing Performance Data (from Measurement Entry window)
- 4ACTION PLANNING
- 5ASSESSMENTS
- 6THE CONTROL PANEL
- 6.1Header Buttons
- 6.2Control Panel tabs: Overview
- 6.3Control Panel display
- 6.4Control Panel tabs
- 6.4.1Dashboard Tab
- 6.4.2Task Tab
- 6.4.2.1Measurement Tasks
- 6.4.2.2Validation Tasks
- 6.4.2.3Action Plan Tasks
- 6.4.3.4Assessment Tasks
- 6.4.3.5Measurement Planner
- 6.4.3Performance Targets Tab
- 6.4.4Reports Tab
- 6.4.5Staff and All Users Tab
- 6.4.6Action Plan Tab
- 7REPORTS
- 8SYSTEM MAINTENANCE
- 9HELP AND SUPPORT
- 2.1The Organisation Structure
Reports
- Performance Target Reports
- Performance Target Summary Report
- Performance Target History Report
- Performance Indicator Status report
- Action Plan Reports
- Assessment Reports
- Corporate Reports
- Corporate Performance Overview
- Corporate Performance Explorer
- Corporate Performance Plan
- Organisation Performance Overview report
- Scorecard View (Perspectives) and by Categories report
- Search Strategy Map by Tag Value
- Group Reports: All Groups / Individual Groups report
- Administrative Reports
- Overdue Measurement Tasks
- Overdue Validation Tasks
- Measurement Tasks Due Today
- Performance Indicator Definitions
- Performance Indicator Audit Trails
- System Log Reports
- Unmeasured Target Report
Reports are accessed either from the dashboard or the reports
tab (with the exception of the action plan performance reports,
both list and summary, that are accessed from the ![]() icon wherever it occurs). Many reports can be
accessed from many parts of the system and also from several types
of summary reports and as such there is a large degree of drill
down flexibility.
icon wherever it occurs). Many reports can be
accessed from many parts of the system and also from several types
of summary reports and as such there is a large degree of drill
down flexibility.
Reports can usually be exported to Excel or Word and saved as HTML documents. For a full list of reports (excluding action plan performance) see Control Panel: Reports Tab.
A lot of the reports in the system are simple, self-explanatory lists (e.g. Overdue Targets, Target Responsibility, Equation Definition) and are not displayed here.
Note: The icons and colours used in all reports follow the Escendency coding standard (see Control Panel display for full key)
Performance Target Reports
Regardless of how they are initially displayed (on the dashboard as part of a performance gauge or a performance pie chart summary) by a histogram (performance status by category report) or in a table (group reports) the final performance target report follows the same format that comprises detailed performance information and graph on a print ready report:
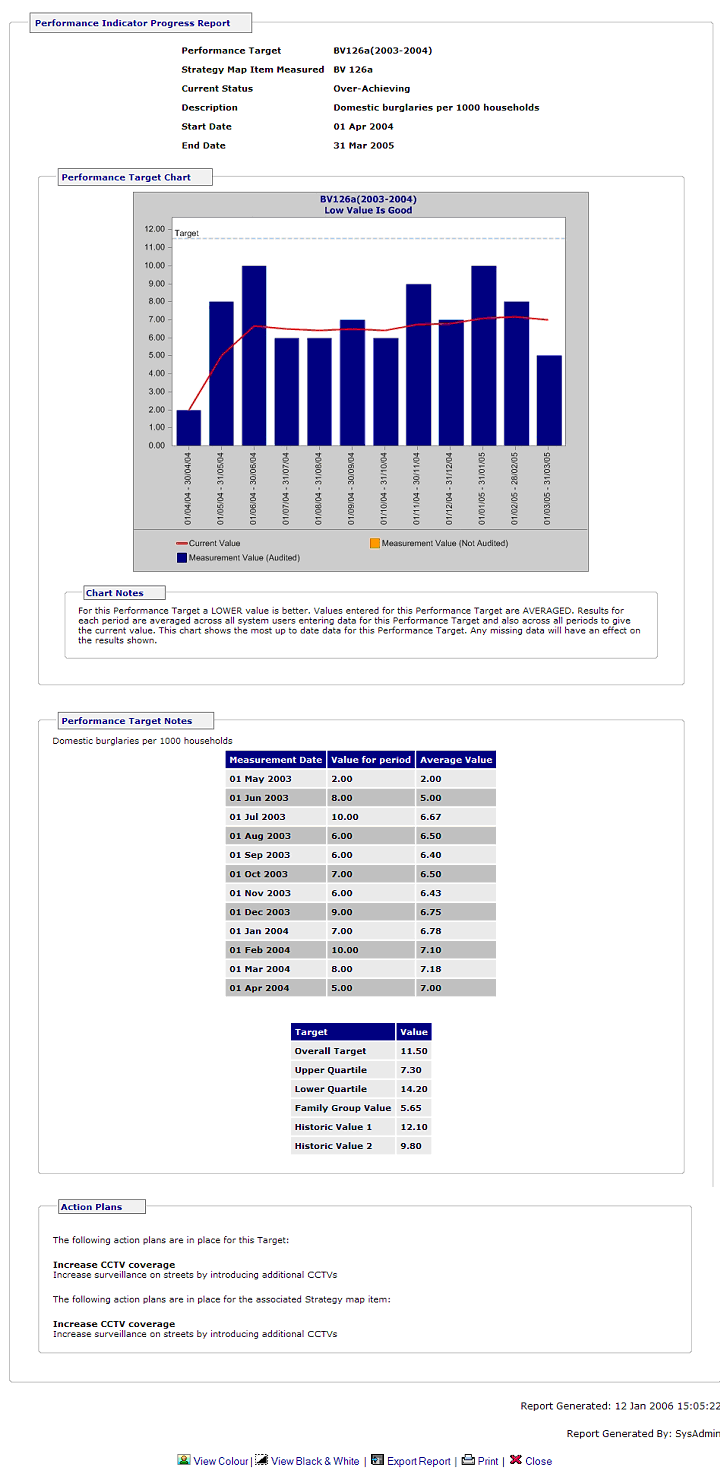
Measurer and validator comments can also be displayed when present as well as additional comments.
Range targets can also be displayed:

The point of access of performance graphs can be from anywhere where performance targets are displayed.
Performance Target Summary Report
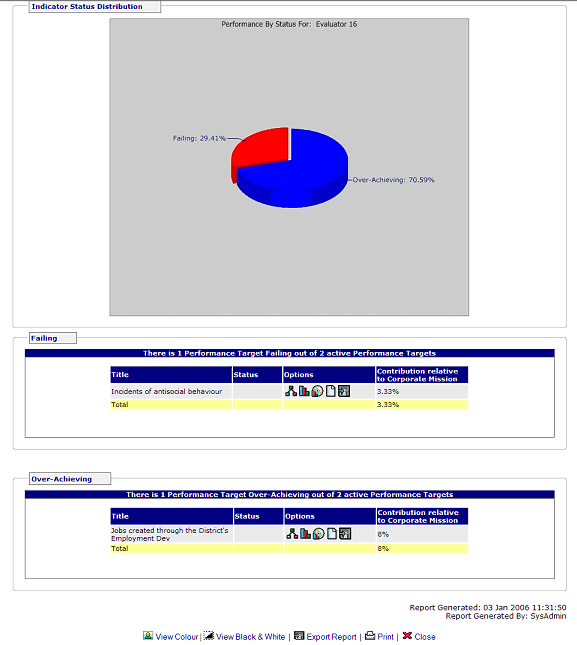
Where collections of performance indicators are grouped a performance summary report can accessed (i.e. the performance indicator status report and the dashboard target pie chart). This displays a pie chart summary of the collected indicators and their targets with a drill down table listing each based on status:
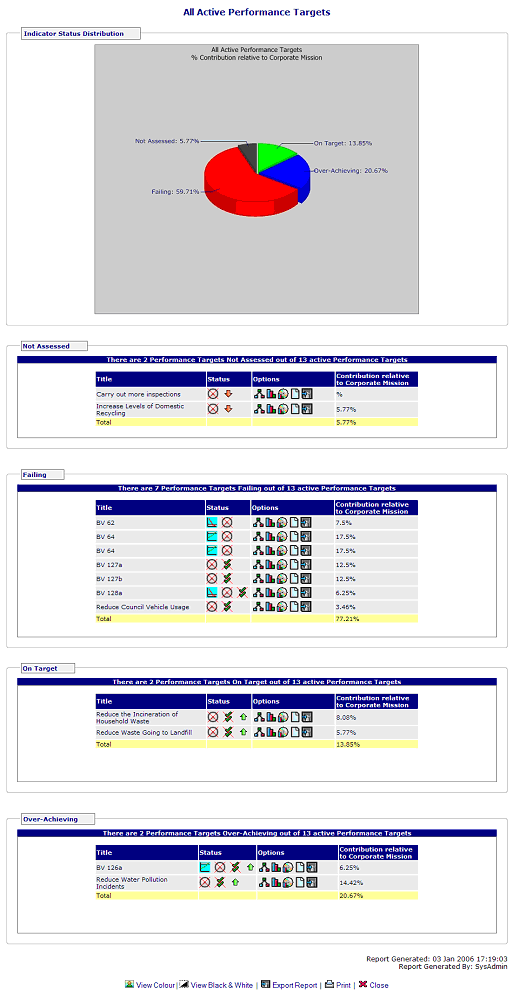
The drill down options are the same as available in the organisation overview (below).
This report is accessed from clicking on the  history icon in either the
corporate performance overview report (below) or from within the
performance target summary report:
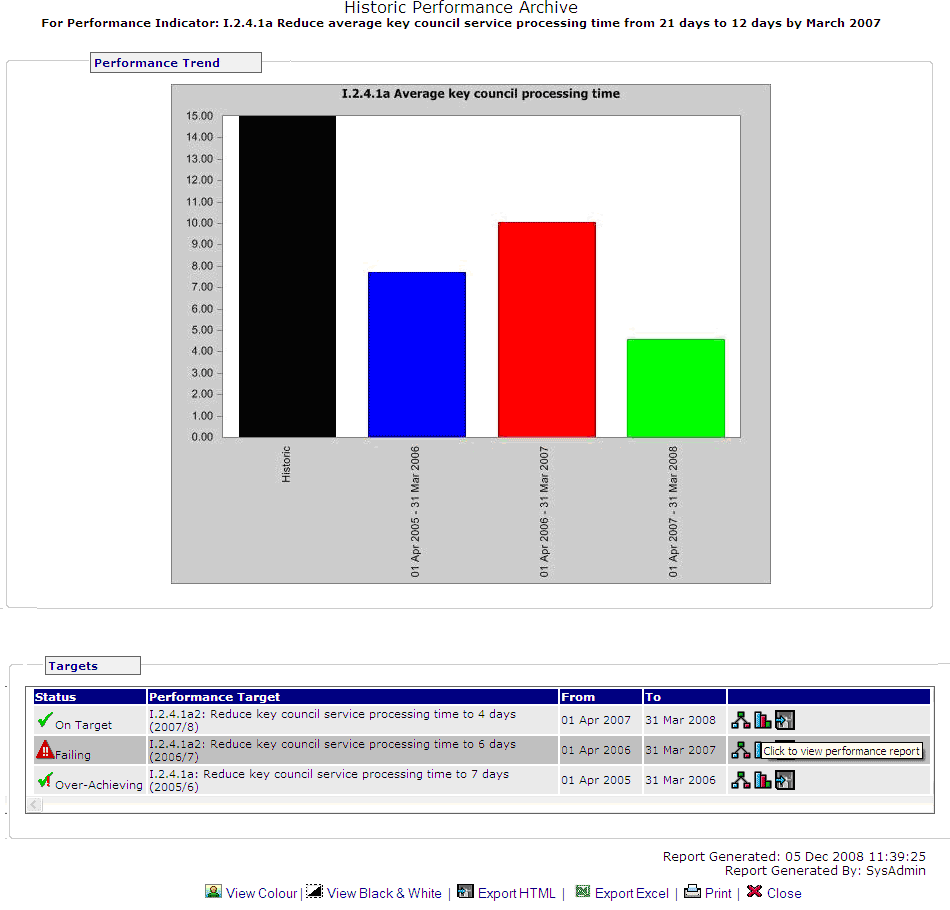
Clicking on the individual graph icons to drill down to a performance report for that particular target.
Performance Indicator Status report
Performance targets can also be displayed by their type, perspective, category or any combination thereof by running the performance indicator status report and selecting the selection criteria:
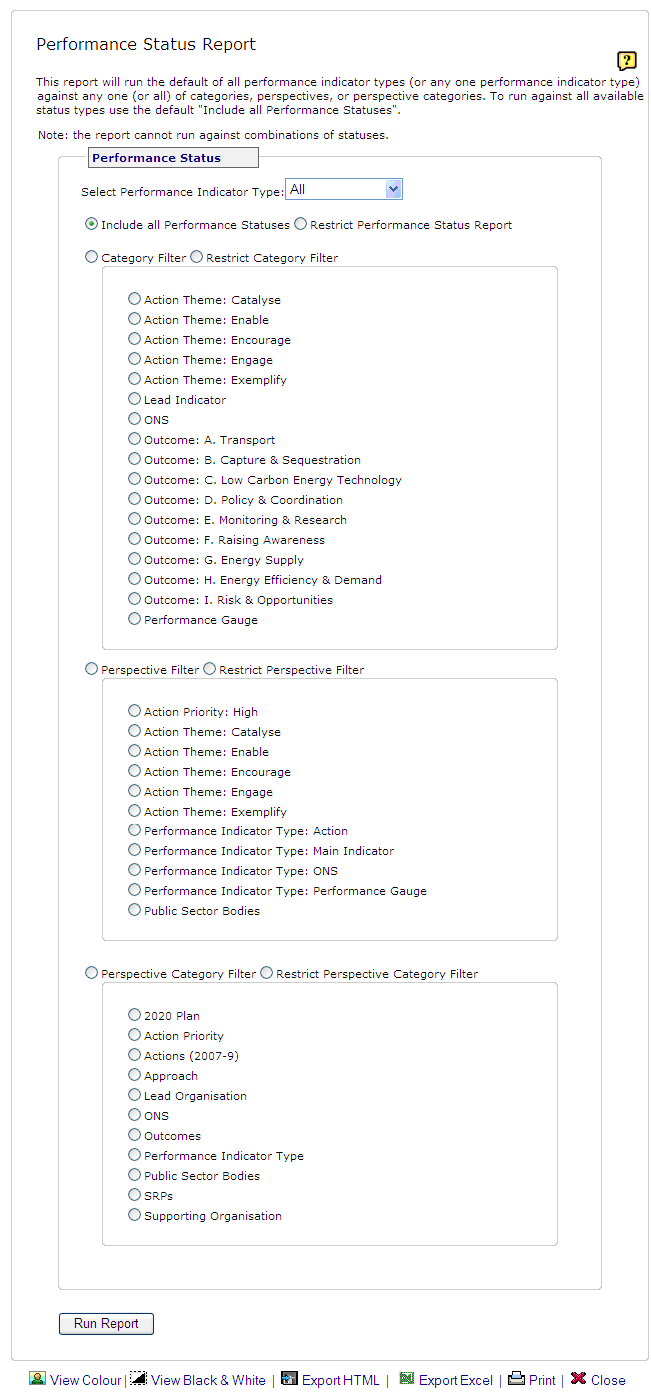
The power of this report becomes evident if, for example, an
auditing body was interested in a particular set of performance
indicators. Categories, perspectives or types could be set up that
pertain just to that auditing body•s interest and the relevant
report run to filter based on those (for example type National
Indicator by DCLG based categories):
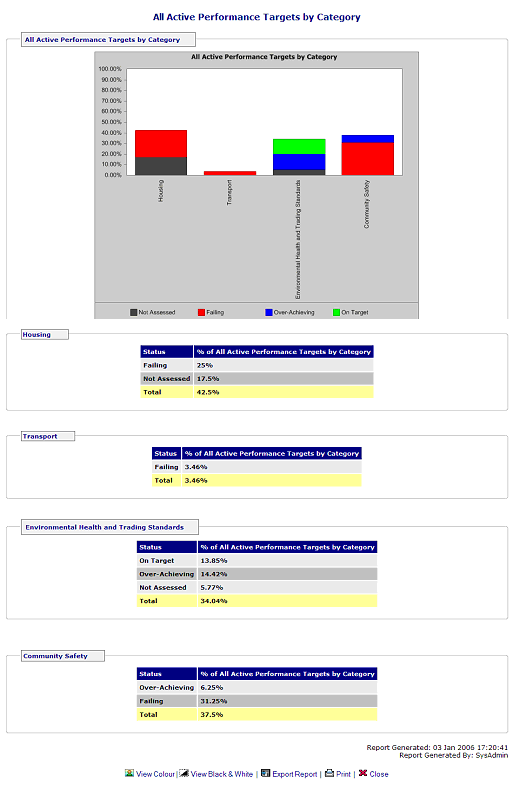
Clicking on each histogram plot will access a performance summary report for that group of targets.
Action Plan Reports
Action plan reports comprise list reports accessed from wherever
the  icon
shows, summary reports (accessed from the dashboard or from each
link on the list report) and individual task reports.
For full breakdown of action plan reporting see action planning: reports.
Assessment Reports
These are covered in Assessments: reporting
Corporate Reports
Corporate Performance Overview
The Corporate Performance Overview (CPO) is available to users with administrative privileges and is a comprehensive view of the organisation's entire performance management system through the strategy map and is used to view the current status of all parts of the organisation's strategy. The power of this report is that all the reports in the system can be accessed in one way or another from this report:
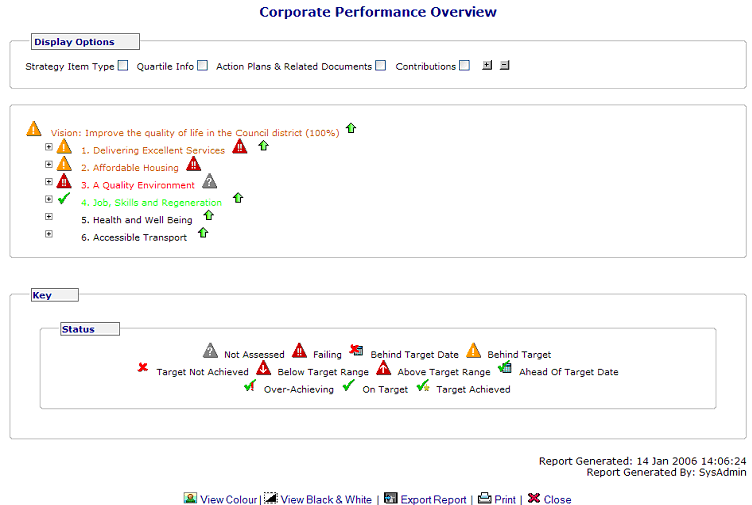
Note: Until year end rollover is completed, all statuses on this report reflect the last completed target. Year end rollover will remove all completed targets from this status report but they will be visible on the historic corporate performance overview by clicking on the icon after selecting the drill down option.
Icons on the left show overall status for that part of the map while icons on the right alert to behind, overdue, and / or not assessed tasks within that node. The trend arrows on the right show whether performance is improving or falling.
The green up arrows indicate the status has improved since the last measurement. An orange down arrow would indicate the status has declined since the last measurement.
Items with active performance targets will always show a status. Items do not need to be measurable in order to have a status: so long as they have measurable descendants, their status will be rolled up from their descendants.
Clicking all the checkbox displays the strategy map icons next to the status icons and the stategy map item key at the base of the page, the quartile information for performance indicators (blue graph icon), alerts on measurements (missing measurements, validation overdue etc), action plans associated with the strategy map, and contributions to vision (in percent):
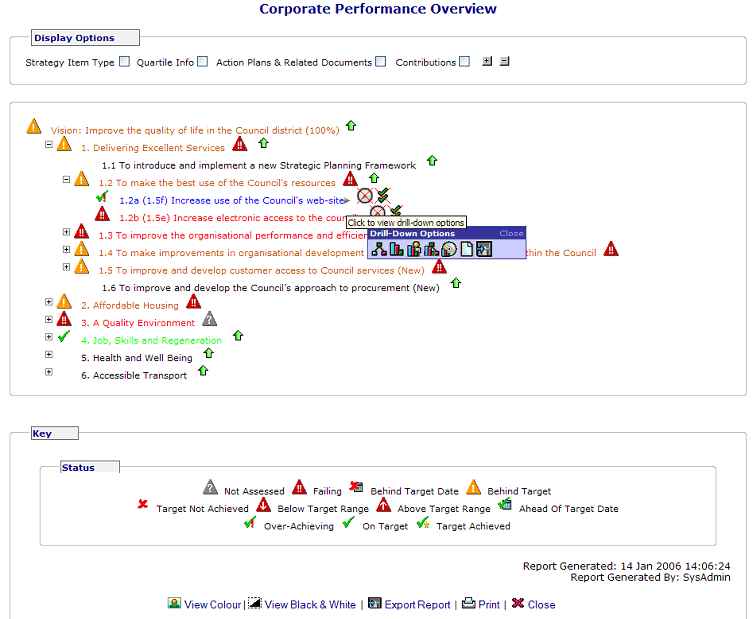
Note: To save clutter the drill down check box hasn•t been selected, instead the drill down options for individual items can be viewed by clicking the icon.
Corporate Performance Explorer
This report is based on exactly the same data as the CPO but shows the organisation•s strategy as ‘mind map• or object explorer view. Drill down is achieved by clicking on each object until reports can be accessed:

Corporate Performance Plan
This report is one of the strengths of the Escendency system. This is the entire corporate plan for the organisation that can be generated in real time and as such includes a breakdown of all performance targets in both tabular and graphical form. It can be run by date to produce a history report (see above).
Because of its size and because it contains many of the reports displayed in this guide it is not shown here. An example can be found at: Corporate Performance Plan Example Report.
Organisation Performance Overview report
This report shows the organisation's overall performance for all posts and levels within the organisation:
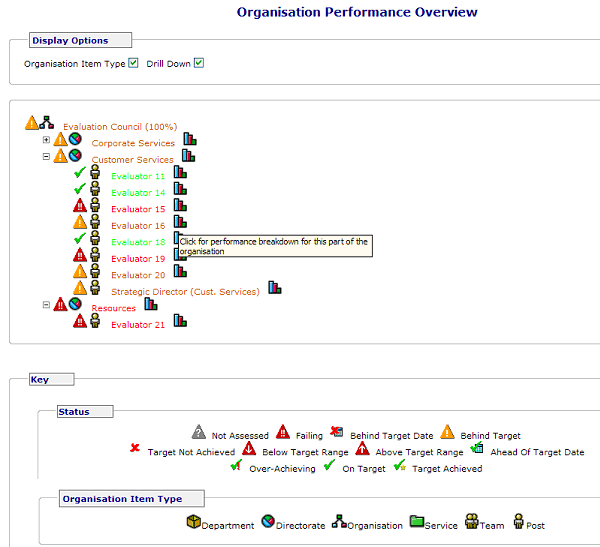
Clicking on the graph icon drills down to the organisation performance graph and target breakdown for that part of the organisation:
Scorecard View (Perspectives) and by Categories report
This report is a graphical and tabular view of active performance indicators by their scorecard perspectives (listed on the left of the report) and their contribution to the whole organisation (for set up see Performance Indicator set up and Scorecard Perspectives):
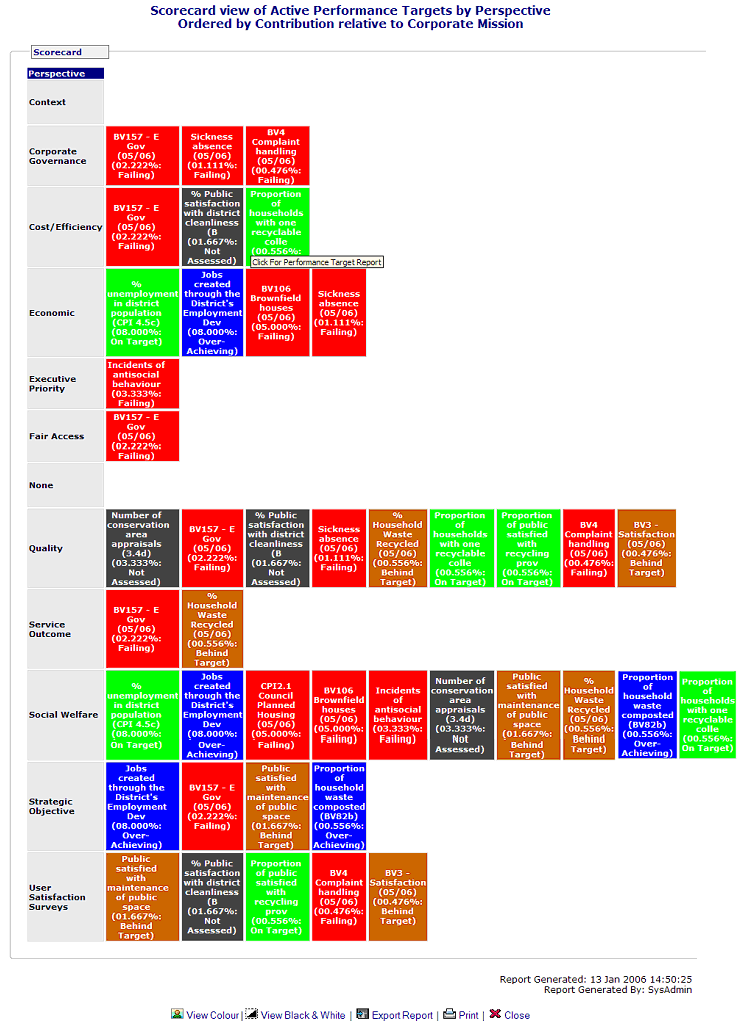
Note: To display a report by date, click on the (By Date) option on the 'Scorecard view' report link and use the date picker to choose a date range to run the report by.
Performance traget reports can be accessed by clicking on one of the coloured blocks representing individual performance targets or on the Perspective title itself to see a summary report of all associated performance target reports which can then be drilled down further to individual performance reports.
Similarly, wherever the ![]() icon appears this can be
clicked to access an action plan list report for the performance
target or perspective depending on its location.
icon appears this can be
clicked to access an action plan list report for the performance
target or perspective depending on its location.
The Scorecard View by Categories filters the perspective report by categories that are associated with perspectives. Because it follows the identical format of the Scorecard View it isn•t shown here but for a detailed example of how to use them see perspective categories example.
Search Strategy Map by Tag Value
This report displays a highlighted part of the strategy map with report drill down options that is located wherever data tags have been added to the strategy map (see Tags for more information on how to set up data tags on the strategy map). The first view a user sees is the Tag Value Search:

Clicking the View button then leads to the strategy map report with the relevant items highlighted:

Group Reports: All Groups / Individual Groups report
Individual group reports are listed on the user's report tab and follow the format of the All Groups report below and so are not covered here. For more information on setting up these reports see reporting groups.
The All Group reports enable user's associated with a particular group/s to view the contribution of those group's performance targets in both tabular and graphical form:
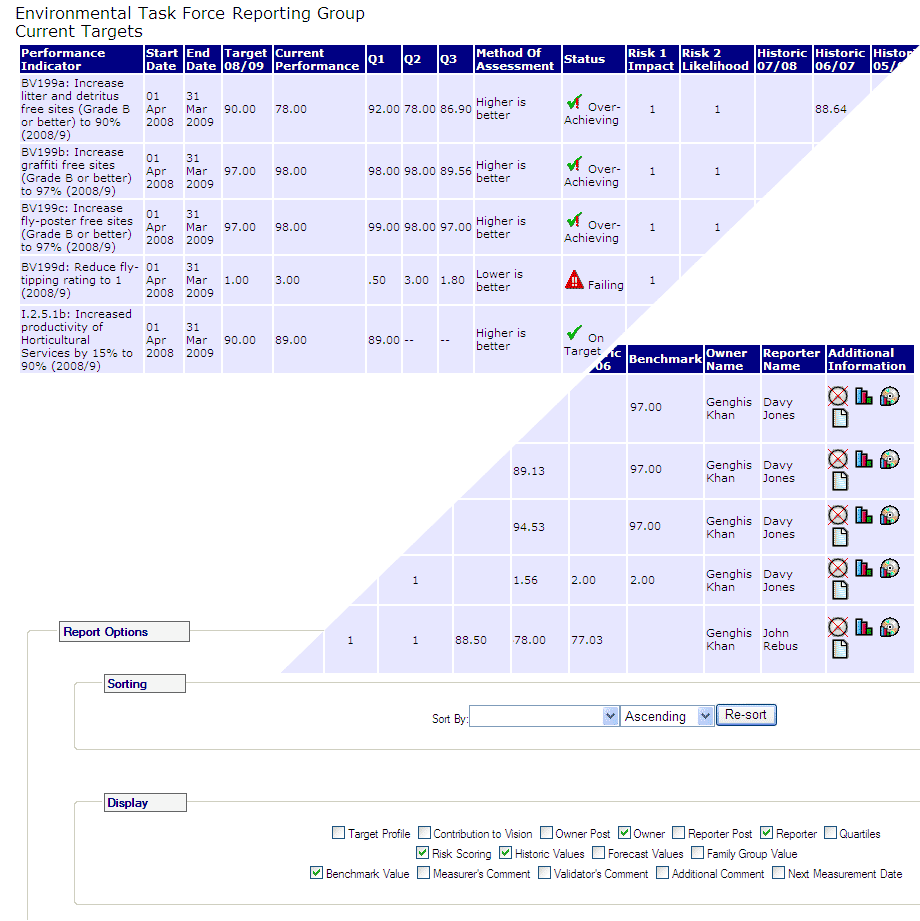
In the Report Options, the user can re-sort the report from the Sorting drop down by contribution to mission, end date, performance target, target owner, start date, or status. Once the sort criteria is selected, click on 'Re-sort'.
Also, the user can choose from the Display checkboxes to display additional Performance Indicator information including Quarterlies, Historic values, Forecast values, Family Group value, Benchmark Value, and Next Measurement Date.
Administrative Reports
A number of lilst reports exist within the system to enable the administrator to effectively manage operations. These are accessed by clicking on the reports tab of the control panel and scrolling down to the ‘Administrative Reports• section. Each report follows the same format as all list pages and so, although discussed, are not displayed here.
The available reports are summarised below:
Overdue Measurement Tasks
This report displays a list of outstanding measurement tasks which are past their due date for measurement.
The following information is listed on the report:
• Target Title;
• PI Reference;
• Due Date – When the task became due;
• Measurement Interval – How often this task becomes
due;
• Responsibility – Post and holder on whose control
panel the task is showing;
The report is sorted from the most down to the least overdue measurement.
Overdue Validation Tasks
This report displays the same information as the Overdue Measurement Tasks report, but shows overdue measurement validation tasks instead of measurement tasks.
Measurement Tasks Due Today
This report displays the same information as the Overdue Measurement Tasks report but shows tasks that are due but not overdue.
Performance Indicator Definitions
This report displays a summary list of PI definitions currently in the system. It can optionally be filtered to show only indicators that have been modified today.
The following information is shown on the report:
• Title;
• Reference ID;
• Type;
• Measurement Type;
• Unit Of Measure;
• High/Low/Range;
• Scale Factor;
• Category;
• Indicator Types – Lists all PI Types associated with
this PI;
• Created On – Date the PI was created;
• Created By – Username of I creator;
• Modified On – Date the PI was last modified;
• Modified By – Username of the last modifier;
Performance Indicator Audit Trails
This report displays full audit information for a given performance indicator target.
The following information is displayed for targets as a whole:
• Target title;
• Related item in strategy map;
• Associated performance indicator;
• Target start date;
• Target end date;
• Target creation date;
• Target creator;
For all measured sub-targets (i.e. those associated with a post) the following is displayed:
• Responsible post;
• Measurement and validation details for each
measurement:
• Date measurement was entered into the system;
• Date measurement was due;
• Value entered;
• Username of original measurer;
• Date measurement was validated;
• Validated value;
• Username of validator;
• Measurement Status (usually open, however measurements
which have been deleted from the system will also be shown
here);
• Measurer•s and Validator•s comments;
• Audit Trail Comments
• Details of any changes which have been made to measurements
by System Administrators;
When the Audit Trail is initially selected from the control panel, a new report window opens displaying an expandable list of all performance indicators which have one or more targets associated with them. Beneath each indicator name is a list of all the target titles associated with the indicator. Selecting one of these targets will open the audit trail report for that target.
System Log Reports
System log reports provide a view of login behaviour between user specified dates. The following types of behaviour can be tracked:
• Successful logins to the system;
• Failed logins;
• Users logging out of the system;
Each report details the date and time an action took place, a log message detailing which user performed the action and the client machine/network IP address.
Unmeasured Target Report
This administrative report lists all current performance targets that have had no measurement responsibility assigned. It also lists targets where measurement responsibility is currently assigned to a vacant post – and whether measurement responsibility has been delegated to another post.
Only System Administrators have access to this report, which can
be run by selecting ‘Unmeasured Targets• from the
Administrative Reports section of the reports tab on the control
panel.

