- 1INTRODUCTION
- 2SETTING UP A NEW SYSTEM
- 2.1The Organisation Structure
- 2.1.1Creating, Editing and Deleting Organisation Chart Items/Adding Posts
- 2.2Users
- 2.2.1Creating, Editing and Deleting Users
- 2.2.2Supporting Data
- 2.2.2.1Access Levels and User Groups
- 2.2.2.2Reporting Group
- 2.3The Strategy Map
- 2.3.1Overview - Flat and Complex Models
- 2.3.2Creating, Editing And Deleting Strategy Map Items
- 2.3.3Strategy Item Types
- 2.3.4StrategyMap Performance Target items
- 2.3.5Strategic Contributions
- 2.3.5.1Normalising Strategic Contributions
- 2.3.5.2Flat Strategy Map
- 2.3.6 Strategy Map Tags
- 2.3.6.1Overview
- 2.3.6.2Setting up data tags
- 2.3.6.3Attaching data tags to performance targets
- 2.3.6.4Reporting data tags
- 2.4Performance Indicators
- 2.4.1Overview
- 2.4.2Performance Indicator List
- 2.4.3Creating, editing and deleting Performance Indicators
- 2.4.4Perspectives and Indicator Types
- 2.4.5Performance Indicators Set Up Considerations
- 2.4.6Supporting data
- 2.4.6.1Performance Indicator Categories
- 2.4.6.2Performance Indicator Types
- 2.4.6.3Scorecard Perspectives
- 2.4.6.3.1How to use Perspectives
- 2.4.6.4Scorecard Perspective Categories
- 2.4.6.4.1How to use Perspective Categories
- 2.4.6.4Units of Measure
- 2.4.6.5Time Intervals
- 2.5Equation Builder
- 2.5.1Creating, Editing, Deleting Equations
- 2.5.1.1Measurements
- 2.5.1.2Parameters
- 2.5.1.3Equations
- 2.5.1.4Example Equation
- 2.5.1.5Attaching Equations to Performance Indicators
- 2.5.1.6Using Performance Indicators in an Equation
- 2.5.1.7Equation measurement workflow
- 2.5.1Creating, Editing, Deleting Equations
- 3PERFORMANCE TARGETS
- 3.1Overview
- 3.2Rules Governing Performance Targets
- 3.3Target Setup: Add/View Targets
- 3.4Target Setup: Target Creation Wizard
- 3.5Entering Target Measurements, Validation and Reporting
- 3.6Editing target fields and related objects
- 3.6.1Edit target fields
- 3.6.2Edit target measurements
- 3.6.3Edit target comments
- 3.6.4Edit target delegation
- 3.7Add/View Responsibility
- 3.8Editing target value for more than one measurer
- 3.9Ending targets
- 3.10TargetExport and Import
- 3.11Exporting Target Data
- 3.12Importing Performance Data (from Measurement Entry window)
- 4ACTION PLANNING
- 5ASSESSMENTS
- 6THE CONTROL PANEL
- 6.1Header Buttons
- 6.2Control Panel tabs: Overview
- 6.3Control Panel display
- 6.4Control Panel tabs
- 6.4.1Dashboard Tab
- 6.4.2Task Tab
- 6.4.2.1Measurement Tasks
- 6.4.2.2Validation Tasks
- 6.4.2.3Action Plan Tasks
- 6.4.3.4Assessment Tasks
- 6.4.3.5Measurement Planner
- 6.4.3Performance Targets Tab
- 6.4.4Reports Tab
- 6.4.5Staff and All Users Tab
- 6.4.6Action Plan Tab
- 7REPORTS
- 8SYSTEM MAINTENANCE
- 9HELP AND SUPPORT
- 2.1The Organisation Structure
Control Panel: Overview
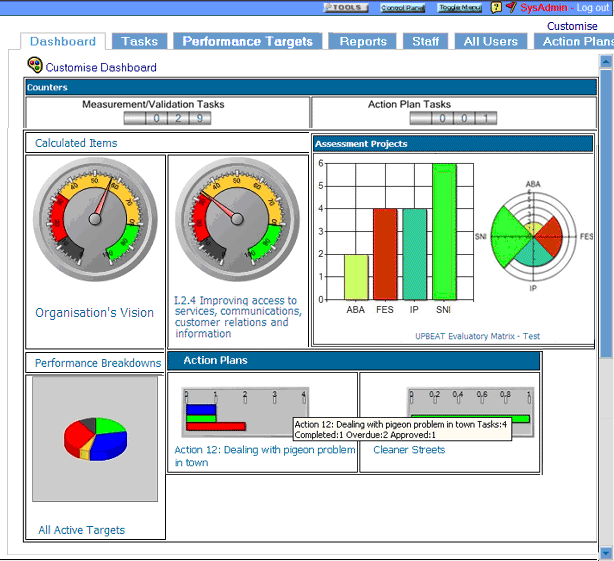
The control panel displays both the user's contribution to the organisation's performance as well as the organisation's performance overall via a number of tabs and reports). Performance progress is displayed using a combination of graphic, literal and colour coded icons (see control panel display below - click on objects in the figure below for more information on each):

Access to performance information will reflect user's responsibilities and privileges within the organisation as well as the posts they are assigned to and the number of staff (if any) assigned to report to those posts. All users will be able to view their own contribution and the organisation's complete strategy map but only users with administrative privileges will be able to view all aspects of the organisation's performance including those of the other users in the system.
On logging into the system the user will default to their control panel. If there are any due or over due measurement and/or validation tasks assigned to that user they will be displayed here on the control panel dashboard.
Header Buttons
The  button accesses the system tool window displaying the tools available to the user. Availability depends on the user's access levels.
The  button displays the classic view with the tool menu options in the control panel on the left hand side. The list depends on the user's access levels. Because this view preceedes the creation of the system tool window the list only contains tool options available before its creation. Clicking the button again will return to the current view.
Note: This feature will be removed in release 5.0.
The  button returns the control panel view, for example if a user is in any of the tool options and wishes to return straight to the control panel.
Control panel tabs
The control panel is comprised of a number of tabs: Tasks, Indicators, Reports, Staff, All Users, and Action Plans. The tabs displayed depend on the user's privileges and allocation of tasks and responsibilities within the organisation. For example, if the organisation doesn't set up action plans there won't be an action plan tab displayed for any users. Similarly, users with no staff assigned to them shouldn't see a Staff tab.
- Dashboard
- All users will have a Dashboard tab that is the default start up page when entering the control panel and is effectively the user's one stop shop for all their performance needs. The dashboard displays the graphics for performance targets, the strategy map, action plans and assessment projects that the user needs to see and all of these graphics can be drilled down into reports. Click on link for more information.
- Tasks
- All users will have a Task tab that displays the user's measurement, validation and / or action plan tasks due and/or overdue. Click link for more information.
- Performance Targets
- All users will have an Indicator tab that displays those indicators they are responsible for measuring. Click link for more information.
- Reports
- There are six report categories available (depending on the user's privileges and assignments): Executive/Overview, Administration, Group, Validator, Performance Indicator and Action Planning. These comprise both overviews of the organisation's performance as well as the user's contribution to the organisation's vision. The two most comprehensive organisation reports are the Corporate Performance Overview and the Corporate Performance Plan (both in Executive/Overview reports). The individual user's contribution to the entire vision in relation to others is clearly displayed in the My Strategy report (in Group reports). Click link for more information.
- Staff
- If a user has staff assigned on the system their control panel can be viewed from this tab. Click link for more information.
- All Users
- Administrators only. This allows access to all system user's control panels including staff (if assigned). Click link for more information.
- Action Plans
- This tab shows the existing organisation's action plans, their status and related items. If the organisation has not created any action plans this tab will be not be displayed. Click link for more information.
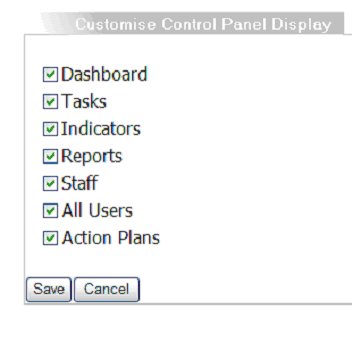
Customise control panel tabs
The display of these tabs can be controlled (depending on the user's privileges) using the Customise link in the top-right corner. Click on the link and select the tabs to be displayed and press "Save":

Note: the tabs a user can see can be set in the Users module.
Control Panel Display
The display of performance information in the system is based on a wide series of icons and colours (on a black and white printer the icons alone would provide the performance status information) but also incorporates text and graphical representation. Because the Control Panel acts as the nexus for the whole system the colour coding and icon use is explained in this section rather than elsewhere though this symbolism is used throughout the system.
These traffic lights based icons are shown below along with information on the default performance thresholds associated with these icons.
Note: Escendency can vary these thresholds for user at user's request.

- Performance measurement validation task due

- Performance measurement validation task overdue

- Caution! Task needs checking

- Performance measurement due

- Performance measurement overdue

- Status improved since last measurement

- Status declined since last measurement

- Report drill down option - available only on measurable items in the tree
The default Traffic Light values corresponding with the main status icons are as follows (note: system administrators can change these values by contacting Escendency):
| High is good | Low is good | |
|---|---|---|
 |
Performance target completed successfully | Performance target completed successfully |
 |
>110% of performance target/phase target | <110% of performance target/phase target |
 |
100% of performance target/phase target | 100% of performance target/phase target |
 |
80-99% of performance target/phase target | 101-120% of performance target/phase target |
 |
79% or less of performance target/phase target | 121% or more of performance target/phase target |
 |
Target not assessed |
In addition, blue is sometimes coded for over exceeding targets, for example in performance target displays:

Drill down options on many reports, additional status indicators and actions are also icon based:
 | Organisation view |  | Export report |
|---|---|---|---|
 | Graph |  | Action Plan |
 | Measurement breakdown at post level |  | Organisation item (see organisation help for full key of post icons) |
 | Measurement breakdown at organisation level |  | Report |
 | Historic / Archived Performance Indicator values |  | Directorate organisation item |
 | Performance Indicator template |  | Performanc target is currently in lower quartile |
 | Performance Indicator definition |  | Performance target is currently in upper quartile |
 | Look up more details |  | Documentation link (usually a URL) |
 | Import to an Excel spreadsheet |  | Task responsibility not accepted yet |
| Not approved (measurement and action plan validation) |  | Task responsibility accepted |
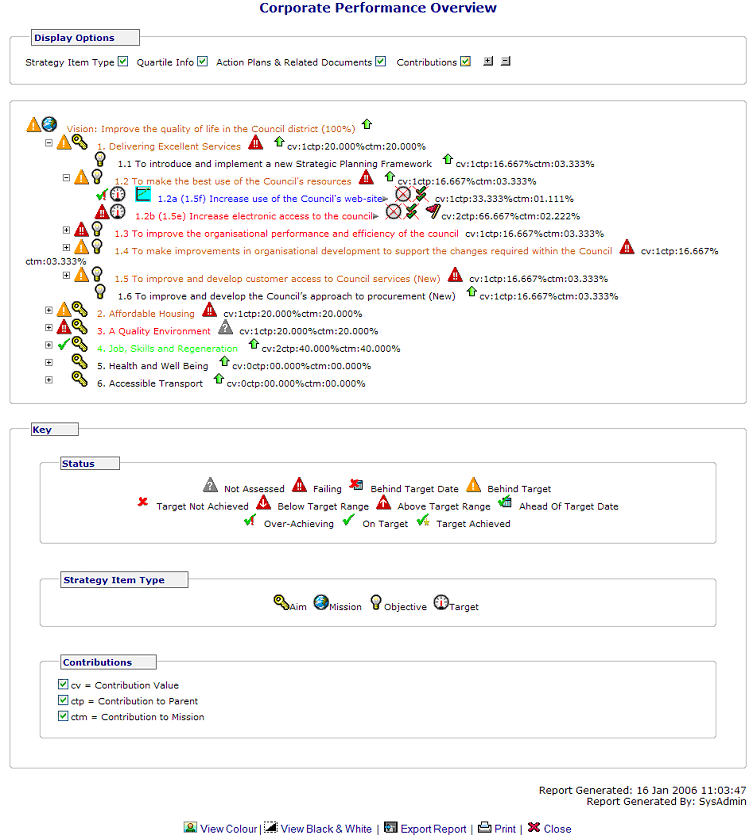
A good location to see many of the Escendency icons at work is in the Corporate Performance Overview report accessed from the reports tab (figure 3 below):

Note: strategy map items are selected from several options
by the organisation administrators so the key above is not generally applicable
for all strategy maps.
Performance status is shown relative to the current indicator's phase target if there is one (or performance target if there isn't), and to the performance target's duration. Strategy map items with no active performance target (and subsequently no assigned performance indicator) have no status display.
Data for "range" performance targets will be inside the range (good) or outside the range (bad). Data for yes/no performance targets will be "yes" or "no":
A performance target's measurement type (high, low, range, date, yes/no, %, or numeric) is set when its relevant performance indicator is created.

