- 1INTRODUCTION
- 2SETTING UP A NEW SYSTEM
- 2.1The Organisation Structure
- 2.1.1Creating, Editing and Deleting Organisation Chart Items/Adding Posts
- 2.2Users
- 2.2.1Creating, Editing and Deleting Users
- 2.2.2Supporting Data
- 2.2.2.1Access Levels and User Groups
- 2.2.2.2Reporting Group
- 2.3The Strategy Map
- 2.3.1Overview - Flat and Complex Models
- 2.3.2Creating, Editing And Deleting Strategy Map Items
- 2.3.3Strategy Item Types
- 2.3.4StrategyMap Performance Target items
- 2.3.5Strategic Contributions
- 2.3.5.1Normalising Strategic Contributions
- 2.3.5.2Flat Strategy Map
- 2.3.6 Strategy Map Tags
- 2.3.6.1Overview
- 2.3.6.2Setting up data tags
- 2.3.6.3Attaching data tags to performance targets
- 2.3.6.4Reporting data tags
- 2.4Performance Indicators
- 2.4.1Overview
- 2.4.2Performance Indicator List
- 2.4.3Creating, editing and deleting Performance Indicators
- 2.4.4Perspectives and Indicator Types
- 2.4.5Performance Indicators Set Up Considerations
- 2.4.6Supporting data
- 2.4.6.1Performance Indicator Categories
- 2.4.6.2Performance Indicator Types
- 2.4.6.3Scorecard Perspectives
- 2.4.6.3.1How to use Perspectives
- 2.4.6.4Scorecard Perspective Categories
- 2.4.6.4.1How to use Perspective Categories
- 2.4.6.4Units of Measure
- 2.4.6.5Time Intervals
- 2.5Equation Builder
- 2.5.1Creating, Editing, Deleting Equations
- 2.5.1.1Measurements
- 2.5.1.2Parameters
- 2.5.1.3Equations
- 2.5.1.4Example Equation
- 2.5.1.5Attaching Equations to Performance Indicators
- 2.5.1.6Using Performance Indicators in an Equation
- 2.5.1.7Equation measurement workflow
- 2.5.1Creating, Editing, Deleting Equations
- 3PERFORMANCE TARGETS
- 3.1Overview
- 3.2Rules Governing Performance Targets
- 3.3Target Setup: Add/View Targets
- 3.4Target Setup: Target Creation Wizard
- 3.5Entering Target Measurements, Validation and Reporting
- 3.6Editing target fields and related objects
- 3.6.1Edit target fields
- 3.6.2Edit target measurements
- 3.6.3Edit target comments
- 3.6.4Edit target delegation
- 3.7Add/View Responsibility
- 3.8Editing target value for more than one measurer
- 3.9Ending targets
- 3.10TargetExport and Import
- 3.11Exporting Target Data
- 3.12Importing Performance Data (from Measurement Entry window)
- 4ACTION PLANNING
- 5ASSESSMENTS
- 6THE CONTROL PANEL
- 6.1Header Buttons
- 6.2Control Panel tabs: Overview
- 6.3Control Panel display
- 6.4Control Panel tabs
- 6.4.1Dashboard Tab
- 6.4.2Task Tab
- 6.4.2.1Measurement Tasks
- 6.4.2.2Validation Tasks
- 6.4.2.3Action Plan Tasks
- 6.4.3.4Assessment Tasks
- 6.4.3.5Measurement Planner
- 6.4.3Performance Targets Tab
- 6.4.4Reports Tab
- 6.4.5Staff and All Users Tab
- 6.4.6Action Plan Tab
- 7REPORTS
- 8SYSTEM MAINTENANCE
- 9HELP AND SUPPORT
- 2.1The Organisation Structure
Performance Indicators
- Overview
- Performance Indicator List
- Creating / Editing Performance Indicators
- Perspectives / Indicator Types
- Performance Indicators Set Up Considerations
Overview
Performance indicators (PIs), accessed from the  button, are the measurement parameters that define performance target measurements.
PIs are attached to the measurable items of the strategy map during the setup of performance targets. PI's can be attached to any number of performance targets and can also be used in equations.
Statutory performance indicators (e.g. one's external to the organisation) and local PI's (e.g. internal to the organisation) are the two default types that come with the system. These indicator types can be edited, deleted or added to in the PI Types module.
Performance Indicator List
On accessing the PI module, the user will see a list of performance indicators (virgin systems will usually not have any unless loading of indicators relevant to the organisation has been pre-arranged ) and the option to add and manage individual performance indicators:
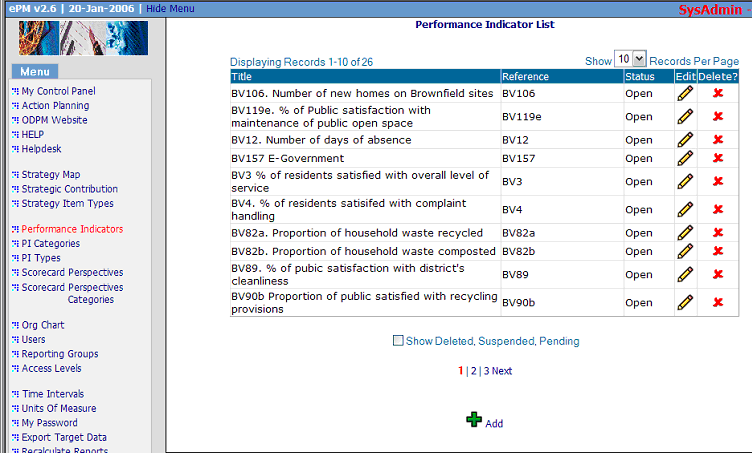
The performance indicator list operates like other list pages in the Escendency system.
As with most Escendency list pages where a lot of records can be expected, the PI list will have a search function. Type all, or a part of, an indicator's name into the search field and then click on the binocular item to locate that, or similar, items in the list.
Creating / Editing Performance Indicators
Click "Add" to add a new indicator, or click an existing indicator to view/edit it and access the Performance Indicator set up page:
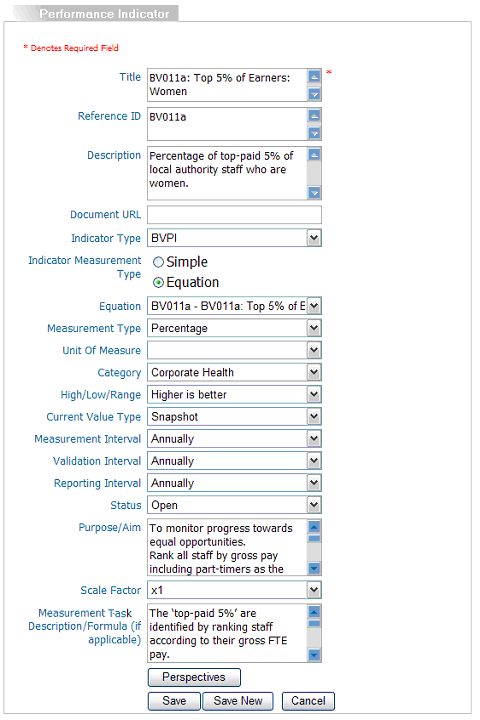
Note: if the performance indicator is already created and has performance target/s associated the indicator cannot be fully edited until:
- All the indicators's performance targets have passed their end date
- All the performance targets' indicators and audit tasks have been completed
- The overnight job has run successfully; whilst doing this it will set finished performance targets' statuses to inactive
A new performance indicator can be created from scratch using the 'Add' button in the Performance Indicator list window or from an existing performance indicator by clicking the 'Save New' button in the Performance Indicator add/edit window provided the reference field has been changed. This is particularly useful for performance indicators that share identical field content. From release 3.10 perspectives from the original performance indicator are also copied over to the new one.
Caution! When setting up a new performance indicator it is very important to pay attention to the parameters used. Once a performance indicator is actively attached to a target it becomes impossible for users to change many of the indicator's parameters, e.g. measurement interval, measurement type, current value type, and high/low/range all of which have a significant impact on the way a performance target is reported and assessed. This point cannot be over stressed.
Performance Indicator Edit Fields
- Title
- the indicators's title.
- Reference ID
- an organisation's reference for more information about the indicators – this needs to be changed if ‘Save new’ feature is to be used.
- Description
- long description for the indicators that will appear on the performance reports. Data enterers will not see this description; they will see the text entered in the "Measurement Instructions" field.
- Measurement Instructions
- these will show in the measurer's measurement entry window that they will access from their task tab in the control panel. These are not displayed in the performance report.
- Document URL
- This will become a link to the external document in the Performance Indicator's library report in My Reports in the Control Panel as well as an external reference link in the measurer’s measurement entry window.
- Indicator Type
- whether the indicator is a statutory (e.g. from an auditing body), or an indicator set up locally within the organisation, or any type that the organisation chooses to use. Additional indicator types can be added or the current one's renamed in the PI Types module.
- Indicator Measurement type
- Indicators can be simple or equation. The former comprise one measurement (for example, 'tonnage of waste sent to landfill') while the latter may require two or more components and are related to a formula (for example, 'percentage of waste collected composted'). These indicators are calculated automatically from simple indicators and/or measurement values that are compiled in an equation. See Equation Builder module help for more information on setting up this type of indicator. Note: Escendency systems come preloaded with equations and measurements for an organisation's statutory performance indicators.
- Restrict decimal places
- This will restrict the number of decimal places displayed in the performance reports. It will not affect calculations of final outturns.
- Equation
- if the indicator measurement type is an equation, then this drop down allows the relevant equation to be selected. The equation, if not preloaded, will need to be set up in the Equation Builder module.
- Measurement type
- the data type of the indicator's measurements (note: these are preconfigured in the system and cannot be edited):
- Numeric (integer)
- whole numbers, e.g. 10
- Numeric (floating point)
- numbers with a decimal point, e.g. 10.04
- Yes/no
- : i.e. “yes” or “no” as to whether the indicator has been done. Can only be used as a snapshot. In many cases these type of indicators are better represented as an action plan
- Currency (£)
- pounds sterling. Users will not need to enter the £ sign
- Percentage
- a decimal number, restricted to values between 0 and 100. Users will not need to enter the % sign (if users want to represent a value < 0 or > 100 as a percent, although this is technically not correct it can be achieved by creating a unit in the Units of Measure module called percent and assigning it the ‘%’ sign.
- Date
- a date. The system will provide users with a date-picker widget
- Note: user can only use "snapshot" as the current value type for date indicators
- Units of indicators
- units that performance targets of the indicators are counted in, e.g. kilogrammes. This is different from "Measurement Type": a performance indicator of 1.5 kg has a measurement type of a floating point number, and a unit of indicators of a kilogramme. Units can be defined in the Units of Measure module. Note: if a different currency type is required other than pounds sterling (e.g. $) that currency can be set up in Units of Measure but the measurement type chosen would be numeric (floating point)
- Category
- originally for those categories defined for local Government they are another means to increase reporting options by breaking down performance targets further than just by type. Categories can be deleted, edited or added to in the PI Categories module.
- High/Low/Range
- determines what value is good for the performance indicator, e.g. for "Percentage of Graduates employed above 20K per annum" a high value would be good, and for "CO2 emissions per capita", a low value would be good. For some kinds of indicators, appropriate values would be in a range, e.g. “number of new houses built” (balanced between housing need and environment). These parameters are fixed in the Escendency system.
- Current value type
- It is very important to get this right before attaching the indicator to an active target. There are three values types - Cumulative, snapshot, and average. The current value type is determined by the way the indicator measurement is input. For example; total tonnage of CO2 emissions would be cumulative if the amount entered was for the measurement period but snapshot if the amount entered was summed to date, the average waiting time for assessments would be an average measure though care must be taken when attempting to average a percent value (see Averaging Percentage Problem below), and identification of the number of contaminated sites could be a snapshot. Snapshots can be used when the value entered is already summed to date (sensible for percentage values) or if a certain threshold level cannot be exceeded in any one measurement period. These parameters are fixed in the Escendency system.
- Measurement interval
- is how often a user assigned to measure the associated performance target/s will be asked to enter data. The Escendency system comes with 8 defaults that can be edited, deleted or added to in the Intervals module
- Validation interval
- is how often the assigned validator will be asked to validate (audit) data that has been entered. This must be larger than the measurement interval
- Reporting interval
- is how often the performance targets will be reported but is actually passive in the system at time of writing
- Status
- indicates whether or not a performance indicator will be available for use. Only "open" indicators are available for use when creating new performance targets
- Aims/Purpose
- This field allows additional information about the measure to be input. It only displays in the performance indicator edit page
- Scale factor
- if data entered will routinely be in large numbers, e.g. in thousands or tens of thousands (for example, large budget values, landfill waste in kilogrammes, regional CO2 emissions in kilogrammes) setting a scale factor can save data enterers from having to enter large number of zeroes (and also reduce data entry errors). Enter a scale factor with an appropriate number of zeroes, e.g. for data to be measured in thousands set a scale factor of a thousand so that instead of entering "6700" the data enterer would enter "6.7"
- Default Owner, Reporter, Validator, Measurer
- If you already know some or all of the responsible post assignments for targets to be associated with this performance indicator you can enter them here by clicking on the post icon. Alternatively, they can be added during target setup.
Perspective/Indicator types
The perspective button gives access to a list of perspective/indicator types that can assist with further classification of the performance indicators, in addition to indicator type and category:
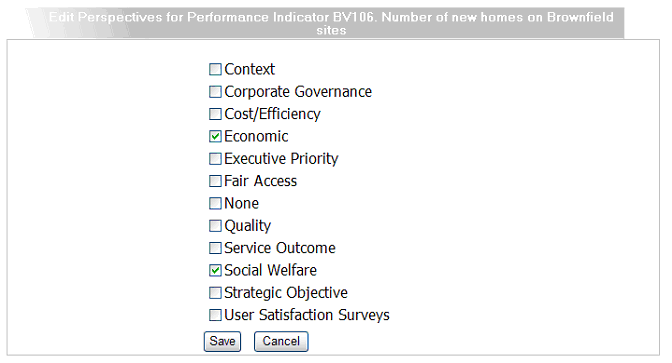
Where perspectives differ from other ways of breaking down indicators is that a indicator can be added to many different perspectives. This means a perspective report can have many perspectives that share the same indicators enabling cross cutting reporting. The Escendency system comes with a default list of scorecard perspectives. These perspectives can be edited, deleted, added to in the Scorecard Perspectives module.
Select one or more perspective/indicator types, and press the "Save" button to save changes. Once back at the main edit window (figure 2) the user can save the changes made to the PI list (figure 1).
Performance Indicators Set Up Considerations
Averaging Percentage Problem
Caution should be used when setting up a performance indicator that is reporting an average percent:
Consider this example using DCLG's performance indicator BV82b(i): Percentage of Household waste composted. This example is particularly relevant because the values may vary signficantly seasonally (more compost in the 3rd quarter because of garden waste). If the measurement is taken quarterly we could have the following hypothetical values (in 1000 tonnes):
| 1st Quarter | 2nd Quarter | 3rd Quarter | 4th Quarter | Total | |
|---|---|---|---|---|---|
| Waste composted | 20 | 30 | 65 | 10 | 125 |
| Total waste | 120 | 120 | 150 | 110 | 500 |
| Average | |||||
| Percent composted (snapshot) | 16.67 | 25.00 | 43.33 | 9.09 | 23.52 |
| Percent composted (cumulative) | 16.67 | 20.83 | 39.74 | 25.00 | 25.00 |
The true average is 25% ((125/4)/(500/4))x100 or (125/500)x100 but if the quarterly snapshot percentages above are averaged the value is not 25.00 but 23.52.
The situation above can best be resolved in two ways:
- Using a simple indicator set to snapshot. The values entered each quarter would be calculated from the sum of the previous values (i.e. from the example above, 20/120, 50/240, 115/390 and 125/500) so that the reported values would be the percentage of waste composted to date as opposed to per quarter.
- Using an equation indicator, also set to snapshot, attached to an equation comprising two summed measurements (tonnes of waste composted to-date and tonnes of waste collected). Each quarterly calculation would in effect mimic example 1. but require less overhead.
Changing indicator measurement intervals and past target reporting problem
If the interval of an existing indicator is to be changed ensure that it has not been used for a previous performance target otherwise the graphs for that target will not display correctly. Use 'Save new' feature in the indicator edit page instead (you will need to change the reference field first) and create a new indicator and edit the measurement intervals accordingly. Rename so the two indicators can be told apart and attach to the new target as needed (you can still use the target wizard but ensure that you repoint to the indicator with the new interval in step 1).
Both indicators will be represented on the same performance report because the report is target focused not indicator focused.
![]()
![]()