- 1INTRODUCTION
- 2SETTING UP A NEW SYSTEM
- 2.1The Organisation Structure
- 2.1.1Creating, Editing and Deleting Organisation Chart Items/Adding Posts
- 2.2Users
- 2.2.1Creating, Editing and Deleting Users
- 2.2.2Supporting Data
- 2.2.2.1Access Levels and User Groups
- 2.2.2.2Reporting Group
- 2.3The Strategy Map
- 2.3.1Overview - Flat and Complex Models
- 2.3.2Creating, Editing And Deleting Strategy Map Items
- 2.3.3Strategy Item Types
- 2.3.4StrategyMap Performance Target items
- 2.3.5Strategic Contributions
- 2.3.5.1Normalising Strategic Contributions
- 2.3.5.2Flat Strategy Map
- 2.3.6 Strategy Map Tags
- 2.3.6.1Overview
- 2.3.6.2Setting up data tags
- 2.3.6.3Attaching data tags to performance targets
- 2.3.6.4Reporting data tags
- 2.4Performance Indicators
- 2.4.1Overview
- 2.4.2Performance Indicator List
- 2.4.3Creating, editing and deleting Performance Indicators
- 2.4.4Perspectives and Indicator Types
- 2.4.5Performance Indicators Set Up Considerations
- 2.4.6Supporting data
- 2.4.6.1Performance Indicator Categories
- 2.4.6.2Performance Indicator Types
- 2.4.6.3Scorecard Perspectives
- 2.4.6.3.1How to use Perspectives
- 2.4.6.4Scorecard Perspective Categories
- 2.4.6.4.1How to use Perspective Categories
- 2.4.6.4Units of Measure
- 2.4.6.5Time Intervals
- 2.5Equation Builder
- 2.5.1Creating, Editing, Deleting Equations
- 2.5.1.1Measurements
- 2.5.1.2Parameters
- 2.5.1.3Equations
- 2.5.1.4Example Equation
- 2.5.1.5Attaching Equations to Performance Indicators
- 2.5.1.6Using Performance Indicators in an Equation
- 2.5.1.7Equation measurement workflow
- 2.5.1Creating, Editing, Deleting Equations
- 3PERFORMANCE TARGETS
- 3.1Overview
- 3.2Rules Governing Performance Targets
- 3.3Target Setup: Add/View Targets
- 3.4Target Setup: Target Creation Wizard
- 3.5Entering Target Measurements, Validation and Reporting
- 3.6Editing target fields and related objects
- 3.6.1Edit target fields
- 3.6.2Edit target measurements
- 3.6.3Edit target comments
- 3.6.4Edit target delegation
- 3.7Add/View Responsibility
- 3.8Editing target value for more than one measurer
- 3.9Ending targets
- 3.10TargetExport and Import
- 3.11Exporting Target Data
- 3.12Importing Performance Data (from Measurement Entry window)
- 4ACTION PLANNING
- 5ASSESSMENTS
- 6THE CONTROL PANEL
- 6.1Header Buttons
- 6.2Control Panel tabs: Overview
- 6.3Control Panel display
- 6.4Control Panel tabs
- 6.4.1Dashboard Tab
- 6.4.2Task Tab
- 6.4.2.1Measurement Tasks
- 6.4.2.2Validation Tasks
- 6.4.2.3Action Plan Tasks
- 6.4.3.4Assessment Tasks
- 6.4.3.5Measurement Planner
- 6.4.3Performance Targets Tab
- 6.4.4Reports Tab
- 6.4.5Staff and All Users Tab
- 6.4.6Action Plan Tab
- 7REPORTS
- 8SYSTEM MAINTENANCE
- 9HELP AND SUPPORT
- 2.1The Organisation Structure
Group Reports: My Strategic Overview
The My Strategic Overview report shows the relative contributions of the user's assignments to the strategy map via the reporting groups module to the overall success of the organisation's vision. The report displays those components of the strategy map the user is responsible for in relation to the whole strategy map and breaks them down by contribution, contribution to the parent item and contribution to the whole vision.
By selecting the 'show navigation icons' the user can also choose to display overdue measurement/validation tasks, action plans, performance indicator measurement graph, historic information on related peformance indicator, definition of the relevant performance indicator, and also export the report in html format.

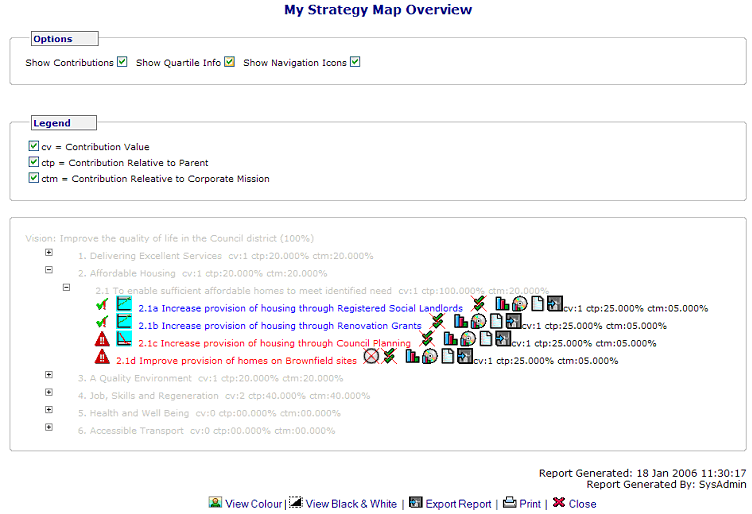
Figure 1: An example of a Strategic Overview report with 'Show Contributions', 'Show Quartile Info', and 'Show Navigation Icons' checked and the user's relevant strategic components expanded. Components and contributions greyed out are not the user's responsibility
Clicking on the navigation icons on the right of the status icons displays more information on the user's strategic contribution/s (see status and navigation icon table below). For example, clicking on the graph icon for a performance indicator produces a full PI graph and report (see example Performance Indicator report):
| Status Icons | Navigation Icons | ||
|---|---|---|---|
 |
Target at risk of failing |  |
Action Plan |
 |
Target failing |  |
Graph |
 |
Target not assessed |  |
Historic / Archived Performance Indicator values |
 |
Target overachieving |  |
Performance Indicator template |
 |
Performance target is in upper quartile (good) |  |
Export report |
 |
Performance target is in lower quartile (not good) | ||
 |
Measurement task overdue | ||
 |
Measurement task due | ||
 |
Validation task due | ||
 |
Validation task overdue |
Note: If the performance targets have been set up with lower and upper quartile values (see performance targets help) these can be displayed by clicking the 'Quartile Info' checkbox. The tree will need to be expanded down to performance target level to view the quartile report icon (click on the '+' icon next to status icons until performance target level is reached).
Note: Contributions can be weighted (see Strategic Contributions help and Editing Strategy Map Items in Strategy Map help). Performance on an item weighted as relatively unimportant will have less effect on the corporate performance overview than performance on an item that is weighted as important. In the example in figure 6 the weighting of performance target 2.1a is 1 (it's contribution is split evenly between the total of 4 performance targets - they all have a ctp of 25.00%). However, if the weighting of 2.1a was 2 the system would calculate its ctp as 40% (the other sibling performance targets would be 20% each if their weighting remained unchanged).
The icons in this report follow the Escendency icon and colour coding standards. Not all the icons that could be displayed for this report are illustrated in the example above. For additional explanation of these and other symbols used in this and other Escendency reports, see icon coding and drill down icons in the control panel help.
Like all Escendency reports the My Strategic Overview report can be exported so that a snap shot can be saved on file as and when required (to do this scroll to the bottom of the report and select the Export Report icon and follow the default). Because of the number of components in the report the file will be saved as a zip file. Users with Windows XP can use the default zipping utility to unzip the file while users of older machines will need a third party zip software.