- 1INTRODUCTION
- 2SETTING UP A NEW SYSTEM
- 2.1The Organisation Structure
- 2.1.1Creating, Editing and Deleting Organisation Chart Items/Adding Posts
- 2.2Users
- 2.2.1Creating, Editing and Deleting Users
- 2.2.2Supporting Data
- 2.2.2.1Access Levels and User Groups
- 2.2.2.2Reporting Group
- 2.3The Strategy Map
- 2.3.1Overview - Flat and Complex Models
- 2.3.2Creating, Editing And Deleting Strategy Map Items
- 2.3.3Strategy Item Types
- 2.3.4StrategyMap Performance Target items
- 2.3.5Strategic Contributions
- 2.3.5.1Normalising Strategic Contributions
- 2.3.5.2Flat Strategy Map
- 2.3.6 Strategy Map Tags
- 2.3.6.1Overview
- 2.3.6.2Setting up data tags
- 2.3.6.3Attaching data tags to performance targets
- 2.3.6.4Reporting data tags
- 2.4Performance Indicators
- 2.4.1Overview
- 2.4.2Performance Indicator List
- 2.4.3Creating, editing and deleting Performance Indicators
- 2.4.4Perspectives and Indicator Types
- 2.4.5Performance Indicators Set Up Considerations
- 2.4.6Supporting data
- 2.4.6.1Performance Indicator Categories
- 2.4.6.2Performance Indicator Types
- 2.4.6.3Scorecard Perspectives
- 2.4.6.3.1How to use Perspectives
- 2.4.6.4Scorecard Perspective Categories
- 2.4.6.4.1How to use Perspective Categories
- 2.4.6.4Units of Measure
- 2.4.6.5Time Intervals
- 2.5Equation Builder
- 2.5.1Creating, Editing, Deleting Equations
- 2.5.1.1Measurements
- 2.5.1.2Parameters
- 2.5.1.3Equations
- 2.5.1.4Example Equation
- 2.5.1.5Attaching Equations to Performance Indicators
- 2.5.1.6Using Performance Indicators in an Equation
- 2.5.1.7Equation measurement workflow
- 2.5.1Creating, Editing, Deleting Equations
- 3PERFORMANCE TARGETS
- 3.1Overview
- 3.2Rules Governing Performance Targets
- 3.3Target Setup: Add/View Targets
- 3.4Target Setup: Target Creation Wizard
- 3.5Entering Target Measurements, Validation and Reporting
- 3.6Editing target fields and related objects
- 3.6.1Edit target fields
- 3.6.2Edit target measurements
- 3.6.3Edit target comments
- 3.6.4Edit target delegation
- 3.7Add/View Responsibility
- 3.8Editing target value for more than one measurer
- 3.9Ending targets
- 3.10TargetExport and Import
- 3.11Exporting Target Data
- 3.12Importing Performance Data (from Measurement Entry window)
- 4ACTION PLANNING
- 5ASSESSMENTS
- 6THE CONTROL PANEL
- 6.1Header Buttons
- 6.2Control Panel tabs: Overview
- 6.3Control Panel display
- 6.4Control Panel tabs
- 6.4.1Dashboard Tab
- 6.4.2Task Tab
- 6.4.2.1Measurement Tasks
- 6.4.2.2Validation Tasks
- 6.4.2.3Action Plan Tasks
- 6.4.3.4Assessment Tasks
- 6.4.3.5Measurement Planner
- 6.4.3Performance Targets Tab
- 6.4.4Reports Tab
- 6.4.5Staff and All Users Tab
- 6.4.6Action Plan Tab
- 7REPORTS
- 8SYSTEM MAINTENANCE
- 9HELP AND SUPPORT
- 2.1The Organisation Structure
Performance Target Progress Report
These reports display the graphical and tabular progress of performance targets linked to a specific strategy map item. They can be accessed from many parts of the system including Measurement and Validation task windows, Corporate Performance Overview report, Organisation Performance Overview reports, Group reports and Scorecard reports (to name a few) and also Performance Indicator (PI) Owners reports (the latter will only display on user's report tab who own performance targets).
The reports are broken down by performance targets over time (e.g. BV126a(2006-2007), BV126a(2007-2008) where BV126a is the performance indicator and the years in brackets are the performance target range). See performance indicator help and performance target help for more information on setting up performance indicators and targets.
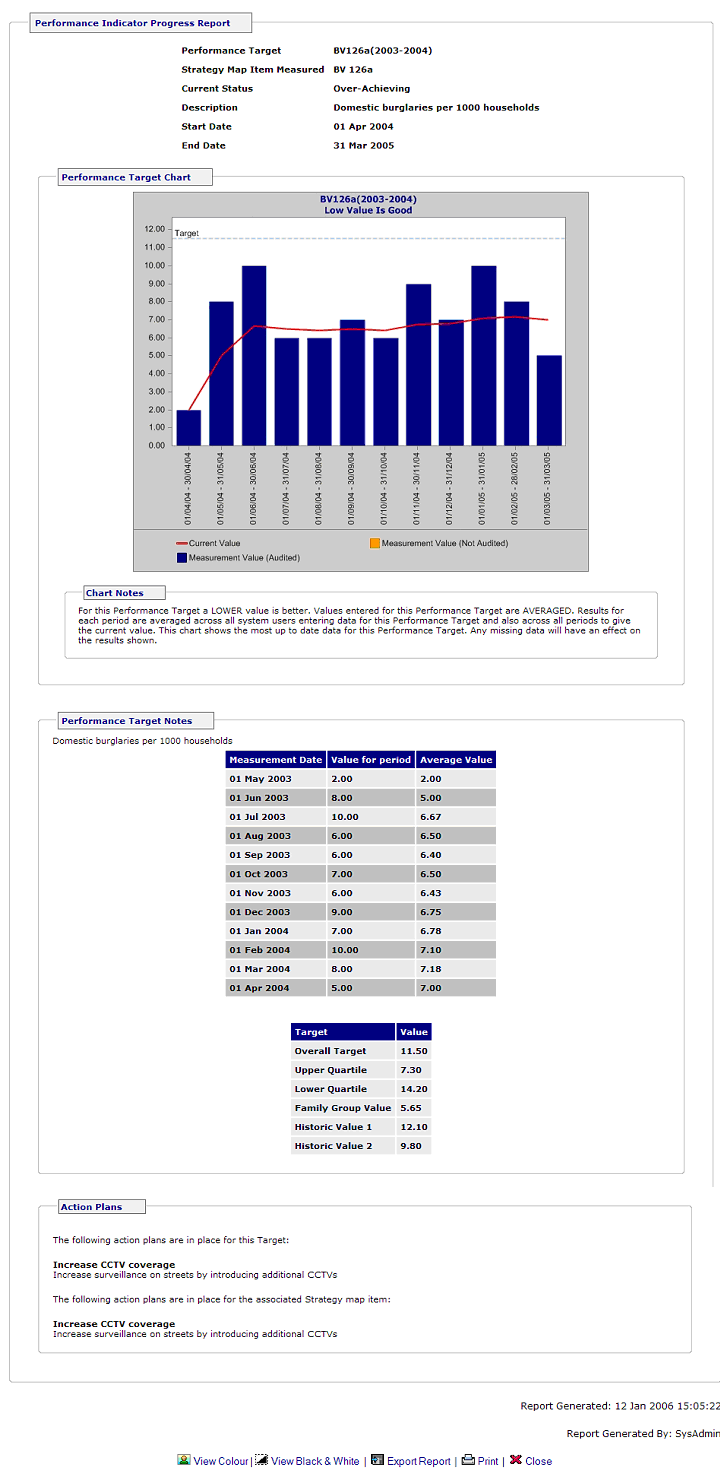
This report is a fully comprehensive graphical and tabular display of the progress of the particular performance target that the performance indicator is used to measure. The report is identical to that accessed from the performance indicator library report and the My Strategic Overview report and is part of the Performance Indicator module. See figure 1 below for an example taken from the Performance Report: BV126a(2004-2005) link on the Performance Indicator Owners Reports list.

Figure 1: An example of a Performance Indicator (BV126a) Progress report for a target set between April 1st 2004 and March 31st 2005
See performance indicator report for another example.
These reports follow the Escendency icon and colour coding standards. For additional explanation of these and other symbols used in these and other Escendency reports, see icon coding and drill down icons in the control panel help.
Like all Escendency reports Performance Indicator Owners reports can be exported and saved on file as and when needed. Users with Windows XP can use the default zipping utility to unzip the file while users of older machines will need a third party zip software.